UX Benchmarking of Highly Technical Products
Benchmarking isn’t just measurement. It’s a forcing function for organizational clarity. Before you can measure, you have to align on what matters. That conversation is often equally as valuable as the metrics themselves.
What Is a UX Benchmark?
A UX benchmark evaluates how real users complete a defined set of core tasks in your product. You recruit participants who match your target user profile, give them realistic scenarios, and measure what happens.
The output tells you:
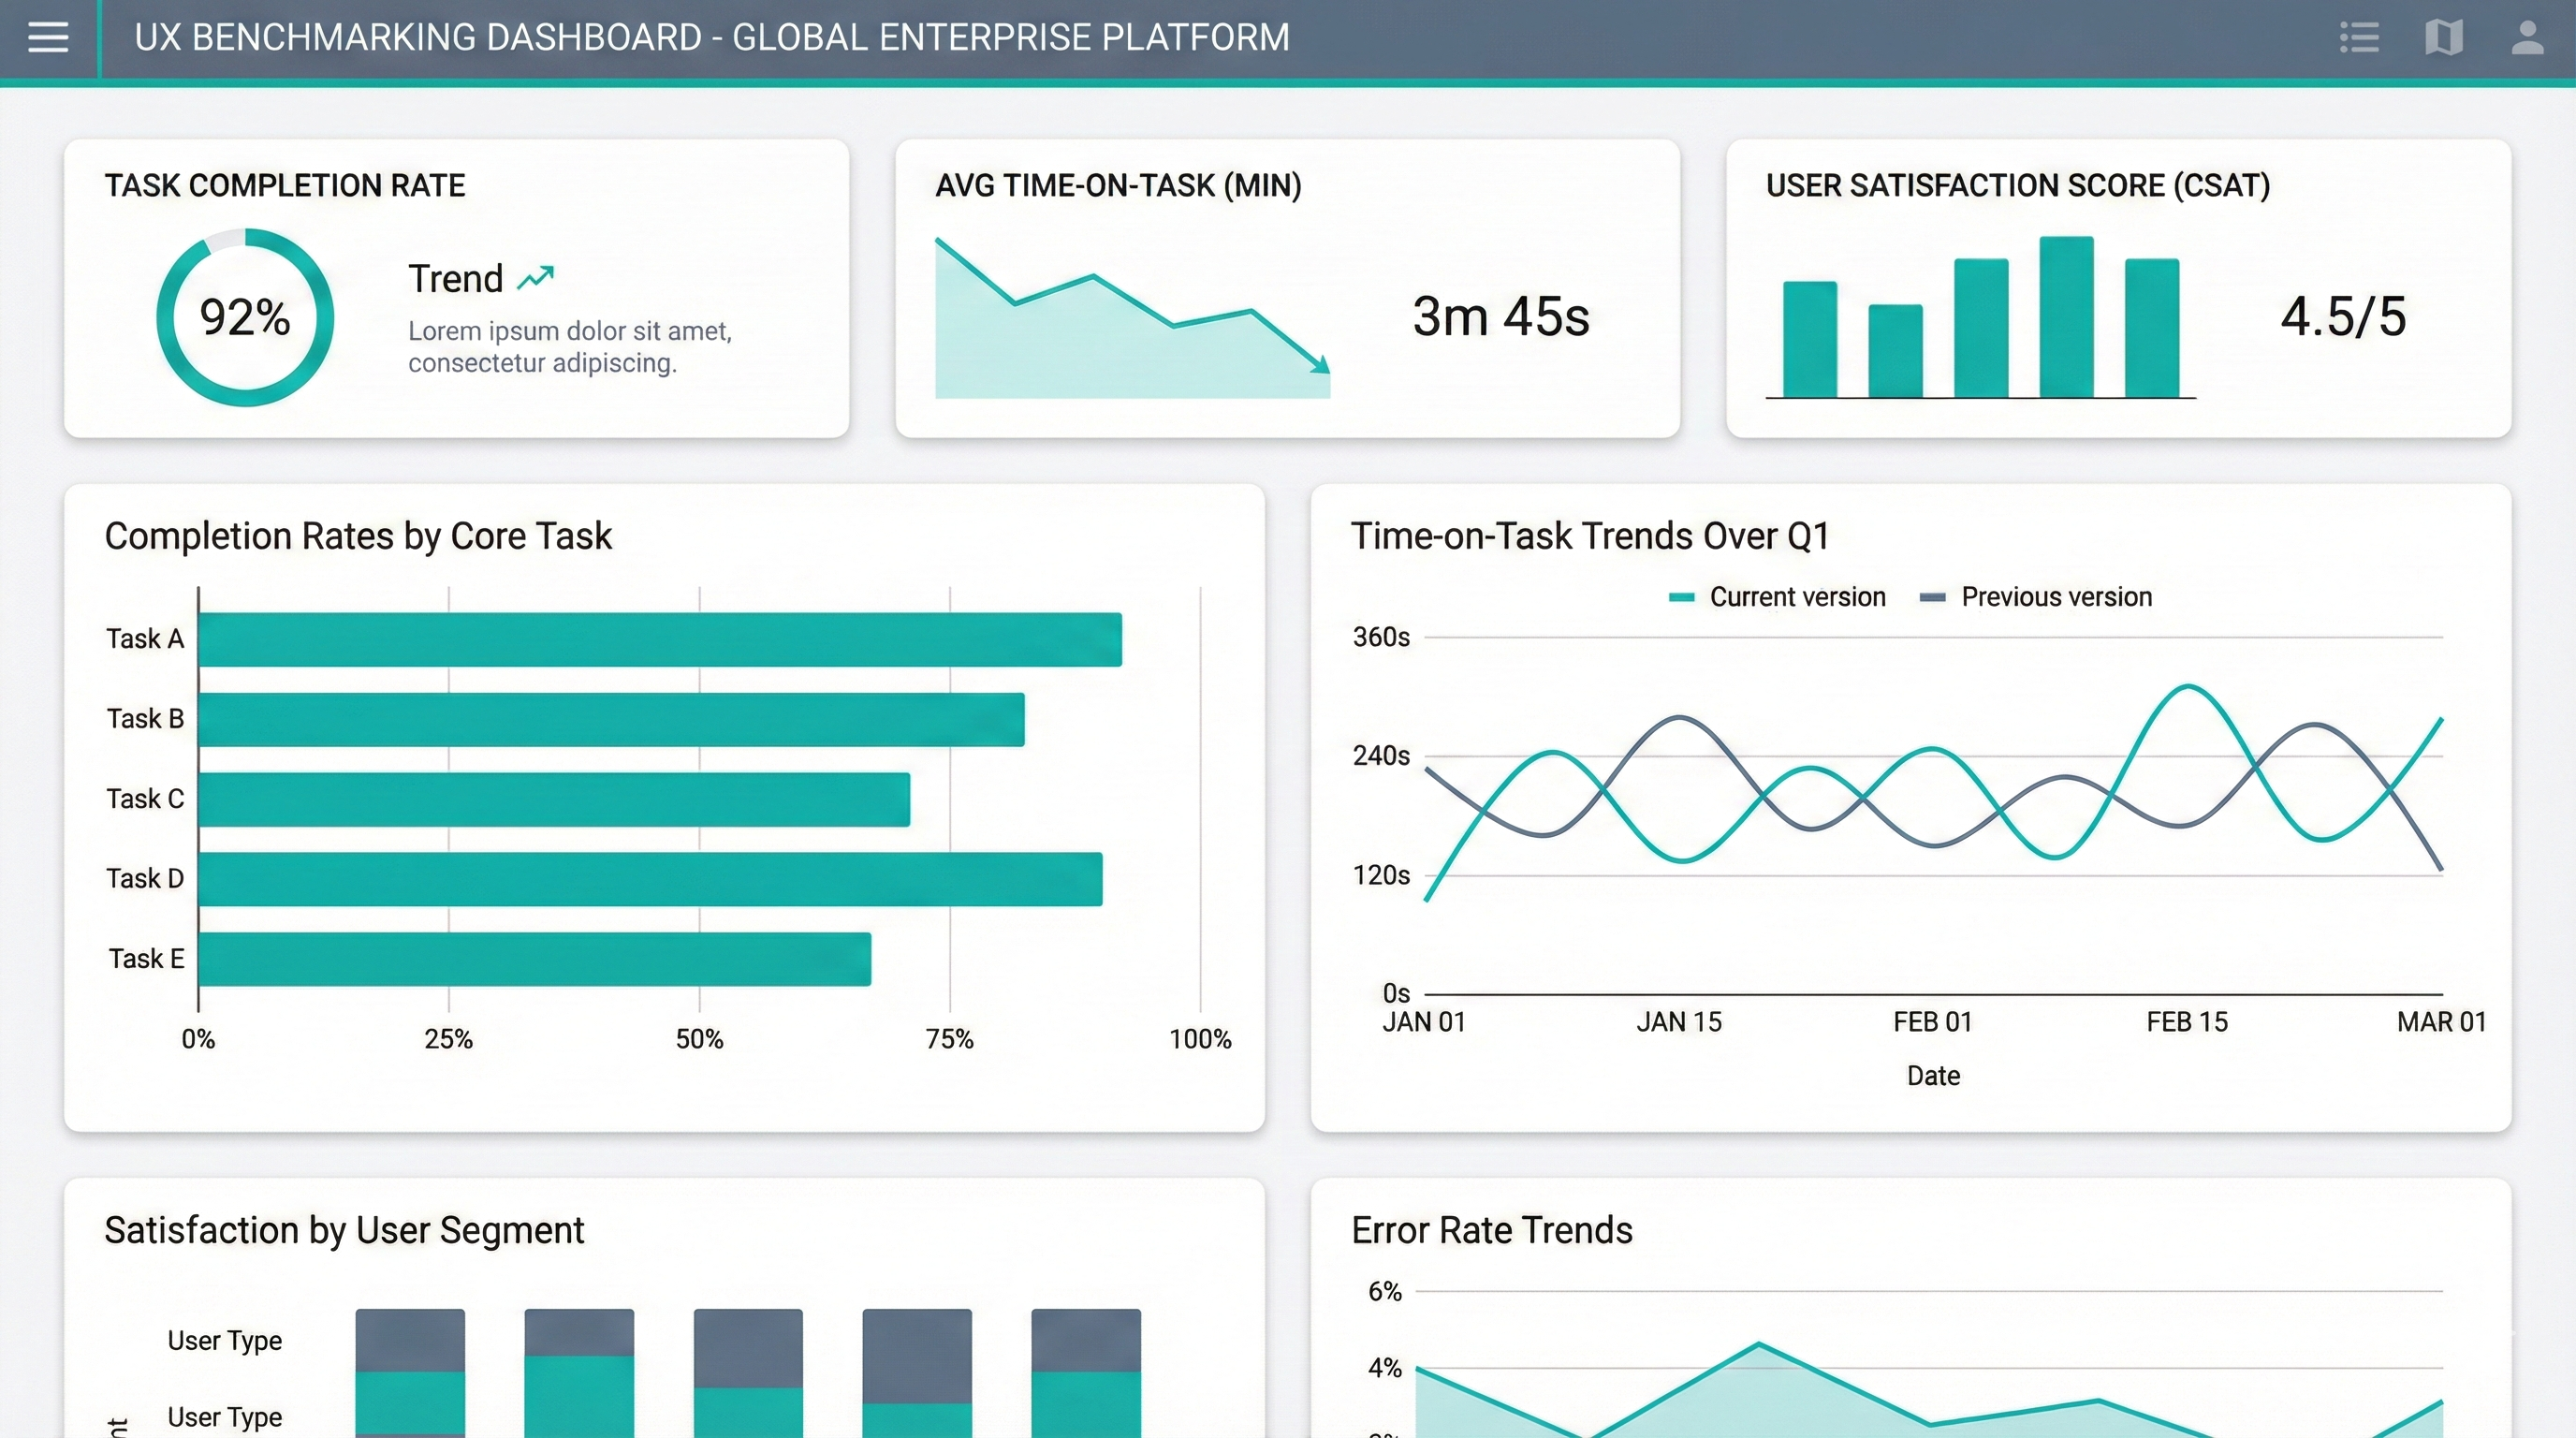
- Task success rates: Can users actually complete the workflows your product is built for?
- Time on task: How long does it take? Is it getting faster or slower across versions?
- Where users struggle: Which steps cause errors, confusion, or abandonment?
- How users feel about it: Subjective ratings of ease, confidence, and satisfaction
Run a benchmark once and you get a snapshot. Run it repeatedly (after redesigns, new releases, or against competitors) and you get a trendline. That’s where the real value emerges: not just knowing where you are, but whether you’re improving.
What It Forces Teams To Do
Align on users. Teams had to agree which end-users mattered most (a Data Scientist versus a Data Analyst, for instance) and define exactly how to screen for them.
Align on tasks. What are the critical onboarding, day 0, and day 30 workflows? Teams had to articulate the jobs their product was hired to do.
Experience the end-to-end. In highly technical product spaces, team members may never have used their own product end to end. Benchmarking forces that reckoning.
What We Measured
The benchmark combined objective and subjective metrics:
Objective metrics:
- Task success/failure rates
- Time on task
- Error rates and recovery paths
Subjective metrics:
- Post-task experience scores (ease-of-use, visual appeal, responsiveness)
- System Usability Scale (SUS)
- Net Promoter Score (NPS)
Why It Spread
The output was actionable and comparable. Standard metrics that worked across studies, product versions, and competitors. When a team wanted to know if their redesign actually improved things, the benchmark told them. When executives wanted to compare their product against a competitor, the benchmark showed it.
This methodology spread organically. Once one team used it and saw the value, others wanted in. Classic land-and-expand: prove value, then grow into different phases of the product cycle.
Running Technical Benchmarks
Prior to cloud services, many of the technical benchmarks I ran were in-person studies using Microsoft Hyper-V. I could configure, snapshot, and reset surprisingly complex environments with just a few clicks.
When I started working with cloud platforms (and especially complex compute like Kubernetes, serverless, app containerization, Docker, and CI/CD tooling), setup and reset became exponentially harder. My superpower is learning new tech fast, but the logistics of doing this in the cloud, often for multiple technologies at once, was being seriously stretched.
This was when I started building a cloud operations team to support technical research. Their job: set up technical products and environments for studies, manage scripted resets between sessions, and ensure everything was reliable across dozens of participants.
It’s a challenging role. You have to dive into a new product on a short timeline, master it well enough to be reliable across research studies, and include sample data and configurations that will be realistic and meaningful for the expert users participating. My research teams could not have done the volume of technical research we managed without this team.
The Go/No-Go Framework
Benchmarking was a quality gate for Microsoft Azure early on. Teams couldn’t ship to General Availability until they hit 80% task-success benchmarks. This came from executive level, not something I had to sell to individual teams. Products could release to Preview without the gate, but GA required passing.
The only friction came when teams missed by a small margin and targeted us as the gatekeeper. Our position was always transparent: we measured, we reported, but we didn’t grant exceptions. That was their management chain’s call. Being the measurer rather than the gatekeeper kept us out of political fights while ensuring the research had teeth.
This is part of my series on building URI.