n8n Demand-Supply Gap Analysis
An evidence-grounded analysis of 14,691 forum posts against 7,209 templates to find where n8n can better support its users, and where it's getting it right.
The Question
n8n has 14,691 forum posts from users hitting walls and 7,209 templates meant to help them. Nobody had systematically compared the two to see whether the help matches the need.
I built a framework to find out.
Some people say, ‘Give the customers what they want.’ But that’s not my approach. Our job is to figure out what they’re going to want before they do.”
Steve Jobs
Jobs was talking about product intuition. But when you have 14,691 forum posts telling you exactly what users want, you don’t need intuition. You need a way to listen at scale.
The Approach
The analysis uses machine learning to identify patterns in both user problems (14,691 forum posts) and available solutions (7,209 templates), then compares them structurally.
Four steps:
- Collect: Pull forum posts (demand) and templates (supply)
- Cluster: Use HDBSCAN and UMAP to identify natural groupings
- Label: Apply BERTopic and LLM-generated summaries to name each cluster
- Compare: Map demand against supply to find gaps, alignment, and emerging signals
This isn’t a survey or a set of interviews. It’s a structural analysis of what users actually struggle with versus what resources actually exist to help them.
A note on scope: “Supply” in this analysis means published templates. Docs, tutorials, and in-product UX are not captured in this dataset, so some gaps identified here may be partially addressed through other channels.
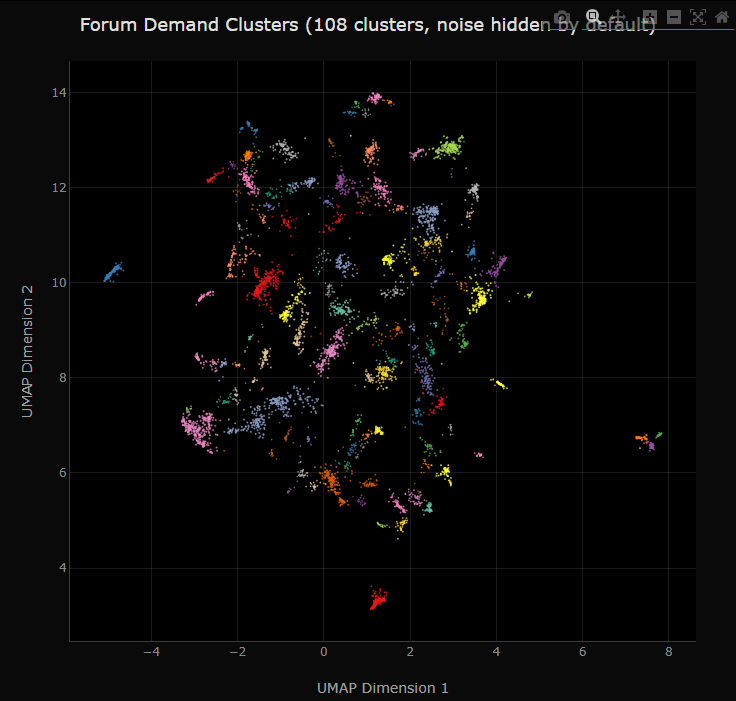
What the Data Looks Like
Each dot below is a forum post, positioned by semantic similarity and colored by cluster. Dense groups represent recurring themes; the tighter the cluster, the more users posted about the same topic.
Six Key Findings
1. Demand Exceeds Supply
Users present 108 distinct problem patterns. Only 65 solution patterns exist. The supply:demand ratio is 0.60:1. But the real issue isn’t volume, it’s category mismatch. Users need debugging help. Templates offer workflow solutions. Different problems, different solutions.
2. Strong Alignment in Key Areas
Some areas work well. WhatsApp Business (319 posts, 211 templates), Calendar/Scheduling (151 posts, 97 templates), and MCP protocol integration show genuine resource-to-need alignment. The templates actually match what users are trying to do.
3. Critical Gaps in Foundational Areas
The three largest demand clusters (OAuth authentication at 418 posts, API credential management at 395 posts, and webhook configuration at 257 posts) have zero dedicated templates or troubleshooting resources. Combined, that’s 1,070 users blocked before they can even reach the stage where templates help.
This is the headline finding. The platform’s biggest pain points are pre-workflow. Users can’t authenticate, can’t configure credentials, can’t set up webhooks, and there’s nothing built to help them through it.
4. Emerging Demand Signals
MCP protocol (245 posts), AI agents (142 posts), and session memory (136 posts) represent expanding needs. These aren’t large yet, but they’re growing fast. Early investment here prevents the kind of support debt that OAuth has accumulated.
5. Noise Is Normal
41% of forum posts remain unclustered. That’s healthy. It means the community is asking varied, non-repetitive questions, a sign of genuine activity, not a problem to solve.
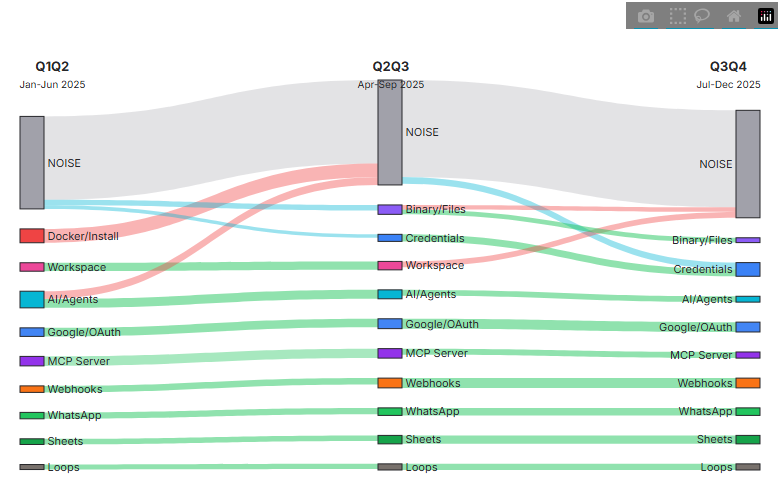
6. Demand Is Highly Dynamic
Cluster composition shows only 48–57% overlap between six-month windows. No clusters maintain 80%+ stability. The demand patterns are genuinely evolving, which means a static analysis done once would be stale within months.
The Sankey diagram below shows how demand themes flow and shift across quarters (topics emerging, dissolving, and persisting over time):
Why This Matters
Closing the top five gaps would address roughly 1,400 blocked user interactions. That’s measurable reduction in support burden, faster onboarding, lower churn risk for users hitting friction in the first hour, and a stronger community. The framework makes the case for prioritizing debugging tools over more workflow templates, a counterintuitive finding that static research methods would likely miss.
The Framework, Not Just the Report
This isn’t a one-time snapshot. The methodology is designed for quarterly re-analysis, tracking which gaps close, which new demand patterns emerge, and whether interventions are working. Persistent pain points like OAuth and webhooks are “stable islands” that need ongoing investment. Emerging patterns like MCP and AI agents need early positioning.
The full report includes interactive scatter plots, alignment matrices, a quarterly tracking framework, and Sankey diagrams showing how demand patterns evolve over time.
What I Used
Run Card
| Data | 14,691 forum posts + 7,209 templates |
| Clustering | HDBSCAN + UMAP (min_cluster_size = 20) |
| Labeling | BERTopic + LLM-generated summaries |
| Output | 108 demand clusters, 65 supply clusters |
| Cadence | Designed for quarterly re-runs to track drift |
LLMs label and summarize. Evidence comes from the underlying clusters and source text.
What I Learned
The biggest surprise was the category mismatch. I expected to find gaps, areas where templates were thin. Instead, the analysis revealed that the entire demand category (operational troubleshooting) is structurally different from the supply category (business workflow templates). Users aren’t asking for a template they can’t find. They’re stuck on a class of problem that templates don’t address.
That’s the kind of insight you get from structural analysis at scale. And it’s the kind of insight that changes resource allocation decisions, not because it confirms what product teams suspected, but because it reframes the problem entirely.